1
/
από
5
PayPal, credit cards. Download editable-PDF and invoice in 1 second!
YS/T 1028.5-2015 English PDF (YST1028.5-2015)
YS/T 1028.5-2015 English PDF (YST1028.5-2015)
Κανονική τιμή
$175.00 USD
Κανονική τιμή
Τιμή έκπτωσης
$175.00 USD
Τιμή μονάδας
/
ανά
Τα έξοδα αποστολής υπολογίζονται κατά την ολοκλήρωση της αγοράς.
Δεν ήταν δυνατή η φόρτωση της διαθεσιμότητας παραλαβής
Delivery: 3 seconds. Download true-PDF + Invoice.
Get QUOTATION in 1-minute: Click YS/T 1028.5-2015
Historical versions: YS/T 1028.5-2015
Preview True-PDF (Reload/Scroll if blank)
YS/T 1028.5-2015: Methods for chemical analysis of lithium iron phosphate. Part 5: Determination of calcium、magnesium、zinc、copper、lead、chromium、sodium、aluminium、nickel、cobalt、manganese content. Inductively coupled plasma atomic emission spectrometry
YS/T 1028.5-2015
YS
NONFERROUS INDUSTRY STANDARD
OF THE PEOPLE'S REPUBLIC OF CHINA
ICS 77.120.99
H 71
Methods for chemical analysis of lithium iron phosphate -
Part 5: Determination of calcium, magnesium, zinc, copper,
lead, chromium, sodium, aluminium, nickel, cobalt,
manganese content - Inductively coupled plasma atomic
emission spectrometry
ISSUED ON: APRIL 30, 2015
IMPLEMENTED ON: OCTOBER 1, 2015
Issued by: Ministry of Industry and Information Technology of PRC
Table of Contents
Foreword ... 3
1 Scope ... 4
2 Method summary ... 4
3 Reagents ... 4
4 Instruments ... 5
5 Samples ... 6
6 Analysis steps ... 6
7 Calculation ... 7
8 Precision... 7
9 Test report ... 9
Methods for chemical analysis of lithium iron phosphate -
Part 5: Determination of calcium, magnesium, zinc, copper,
lead, chromium, sodium, aluminium, nickel, cobalt,
manganese content - Inductively coupled plasma atomic
emission spectrometry
1 Scope
This part of YS/T 1028 specifies the determination method of the content of calcium,
magnesium, zinc, copper, lead, chromium, sodium, aluminium, nickel, cobalt and
manganese in lithium iron phosphate.
This part applies to the determination of the content of calcium, magnesium, zinc,
copper, lead, chromium, sodium, aluminium, nickel, cobalt and manganese in lithium
iron phosphate. The measurement range is shown in Table 1.
2 Method summary
The sample is dissolved with hydrochloric acid, the carbon in it is filtered out, and the
element to be measured is measured by using an inductively coupled plasma atomic
emission spectrometer.
3 Reagents
3.1 Hydrochloric acid (guaranteed reagent, ρ≈1.19 g/mL).
5 Samples
The particle size of the sample shall not be larger than 0.10 mm.
6 Analysis steps
6.1 Specimen
Weigh the sample (Chapter 5) according to Table 3, accurate to 0.0001 g.
6.2 Number of measurements
Weigh 2 specimens, conduct parallel measurements, and take the average value.
6.3 Blank test
Do a blank test along with the specimen.
6.4 Specimen handling
Place the specimen (6.1) in a 100 mL quartz beaker, moisten it with a small amount of
water, add 20 mL of hydrochloric acid (3.2), cover it with a watch glass, and heat it at
low temperature to a slight boil in a fume hood for 3 ~ 5 minutes; blow wash the watch
glass with a small amount of water, filter with filter paper after cooling, and wash the
filter residue with water 5 ~ 7 times; transfer the filtrate into a volumetric flask
according to the corresponding test solution volume in Table 3, dilute with water to the
mark, mix well for later use; at the same time, make a reagent blank.
6.5 Drawing of working curve
Accurately pipette 0 mL, 0.40 mL, 1.00 mL, 2.00 mL, 5.00 mL, 10.00 mL, and 20.00
mL of mixed standard solution (3.5) into 100 mL volumetric flasks, dilute to the mark
with hydrochloric acid (3.3), and mix well. On the ICP spectrometer with optimized
parameters, measure the spectral intensity of each element such as calcium, magnesium,
zinc, copper, lead, chromium, sodium, aluminium, nickel, cobalt, and manganese, and
draw a working curve.
6.6 Determination
On the ICP spectrometer with optimized parameters, measure the spectral intensity of
calcium, magnesium, zinc, copper, lead, chromium, sodium, aluminium, nickel, cobalt,
and manganese in the blank solution and sample solution, and obtain the concentrations
of corresponding components from the working curve. For the sample whose element
content exceeds the concentration range of the working curve, it can be measured after
quantitative dilution.
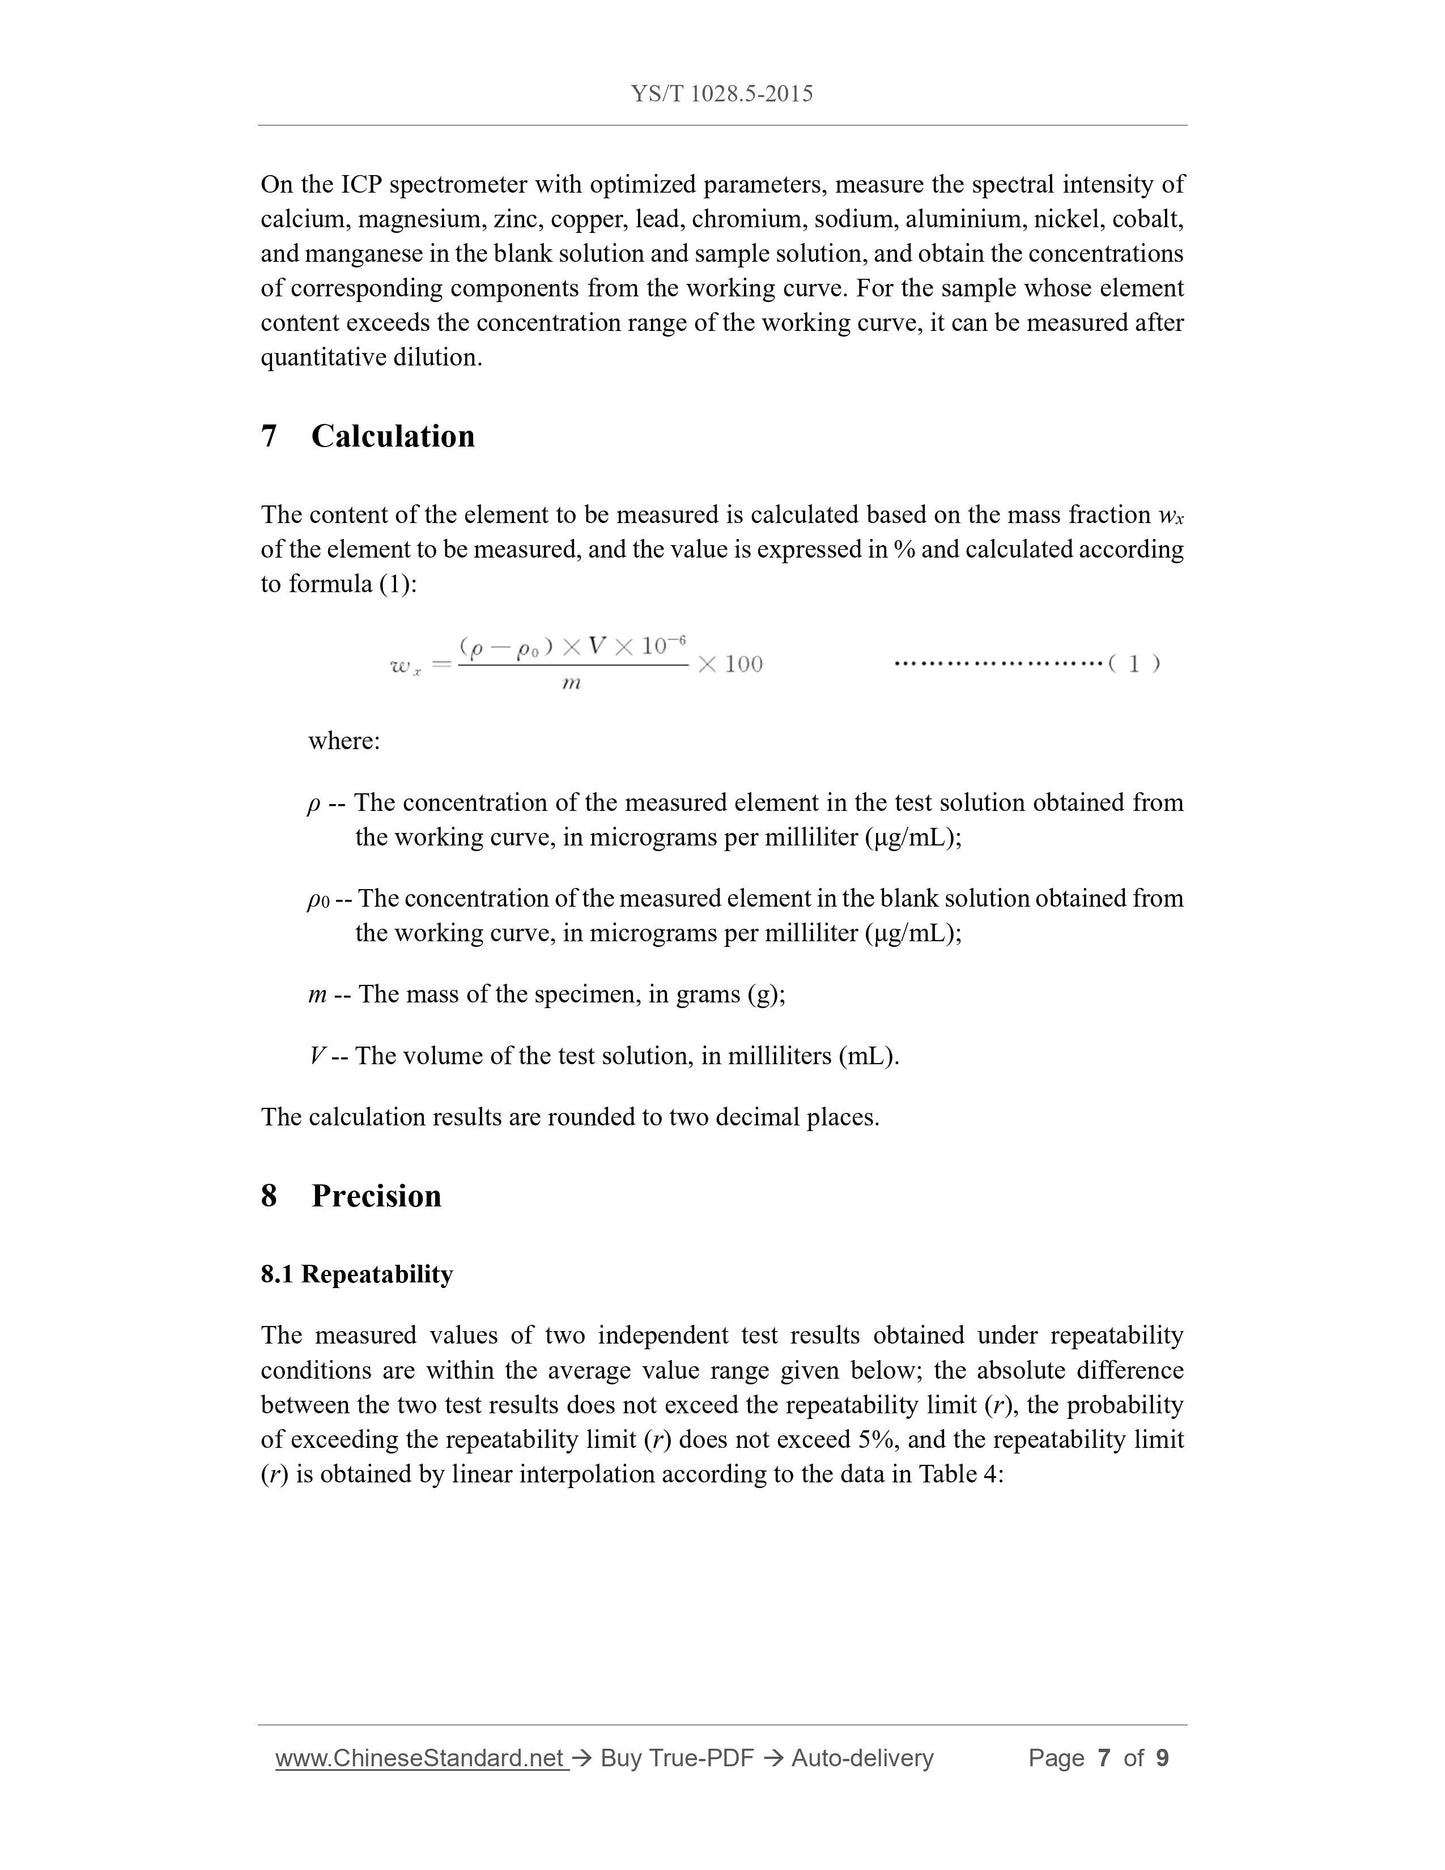
7 Calculation
The content of the element to be measured is calculated based on the mass fraction wx
of the element to be measured, and the value is expressed in % and calculated according
to formula (1):
where:
ρ -- The concentration of the measured element in the test solution obtained from
the working curve, in micrograms per milliliter (μg/mL);
ρ0 -- The concentration of the measured element in the blank solution obtained from
the working curve, in micrograms per milliliter (μg/mL);
m -- The mass of the specimen, in grams (g);
V -- The volume of the test solution, in milliliters (mL).
The calculation results are rounded to two decimal places.
8 Precision
8.1 Repeatability
The measured values of two independent test results obtained under repeatability
conditions are within the average value range given below; the absolute difference
between the two test results does not exceed the repeatability limit (r), the probability
of exceeding the repeatability limit (r) does not exceed 5%, and the repeatability limit
(r) is obtained by linear interpolation according to the data in Table 4:
Get QUOTATION in 1-minute: Click YS/T 1028.5-2015
Historical versions: YS/T 1028.5-2015
Preview True-PDF (Reload/Scroll if blank)
YS/T 1028.5-2015: Methods for chemical analysis of lithium iron phosphate. Part 5: Determination of calcium、magnesium、zinc、copper、lead、chromium、sodium、aluminium、nickel、cobalt、manganese content. Inductively coupled plasma atomic emission spectrometry
YS/T 1028.5-2015
YS
NONFERROUS INDUSTRY STANDARD
OF THE PEOPLE'S REPUBLIC OF CHINA
ICS 77.120.99
H 71
Methods for chemical analysis of lithium iron phosphate -
Part 5: Determination of calcium, magnesium, zinc, copper,
lead, chromium, sodium, aluminium, nickel, cobalt,
manganese content - Inductively coupled plasma atomic
emission spectrometry
ISSUED ON: APRIL 30, 2015
IMPLEMENTED ON: OCTOBER 1, 2015
Issued by: Ministry of Industry and Information Technology of PRC
Table of Contents
Foreword ... 3
1 Scope ... 4
2 Method summary ... 4
3 Reagents ... 4
4 Instruments ... 5
5 Samples ... 6
6 Analysis steps ... 6
7 Calculation ... 7
8 Precision... 7
9 Test report ... 9
Methods for chemical analysis of lithium iron phosphate -
Part 5: Determination of calcium, magnesium, zinc, copper,
lead, chromium, sodium, aluminium, nickel, cobalt,
manganese content - Inductively coupled plasma atomic
emission spectrometry
1 Scope
This part of YS/T 1028 specifies the determination method of the content of calcium,
magnesium, zinc, copper, lead, chromium, sodium, aluminium, nickel, cobalt and
manganese in lithium iron phosphate.
This part applies to the determination of the content of calcium, magnesium, zinc,
copper, lead, chromium, sodium, aluminium, nickel, cobalt and manganese in lithium
iron phosphate. The measurement range is shown in Table 1.
2 Method summary
The sample is dissolved with hydrochloric acid, the carbon in it is filtered out, and the
element to be measured is measured by using an inductively coupled plasma atomic
emission spectrometer.
3 Reagents
3.1 Hydrochloric acid (guaranteed reagent, ρ≈1.19 g/mL).
5 Samples
The particle size of the sample shall not be larger than 0.10 mm.
6 Analysis steps
6.1 Specimen
Weigh the sample (Chapter 5) according to Table 3, accurate to 0.0001 g.
6.2 Number of measurements
Weigh 2 specimens, conduct parallel measurements, and take the average value.
6.3 Blank test
Do a blank test along with the specimen.
6.4 Specimen handling
Place the specimen (6.1) in a 100 mL quartz beaker, moisten it with a small amount of
water, add 20 mL of hydrochloric acid (3.2), cover it with a watch glass, and heat it at
low temperature to a slight boil in a fume hood for 3 ~ 5 minutes; blow wash the watch
glass with a small amount of water, filter with filter paper after cooling, and wash the
filter residue with water 5 ~ 7 times; transfer the filtrate into a volumetric flask
according to the corresponding test solution volume in Table 3, dilute with water to the
mark, mix well for later use; at the same time, make a reagent blank.
6.5 Drawing of working curve
Accurately pipette 0 mL, 0.40 mL, 1.00 mL, 2.00 mL, 5.00 mL, 10.00 mL, and 20.00
mL of mixed standard solution (3.5) into 100 mL volumetric flasks, dilute to the mark
with hydrochloric acid (3.3), and mix well. On the ICP spectrometer with optimized
parameters, measure the spectral intensity of each element such as calcium, magnesium,
zinc, copper, lead, chromium, sodium, aluminium, nickel, cobalt, and manganese, and
draw a working curve.
6.6 Determination
On the ICP spectrometer with optimized parameters, measure the spectral intensity of
calcium, magnesium, zinc, copper, lead, chromium, sodium, aluminium, nickel, cobalt,
and manganese in the blank solution and sample solution, and obtain the concentrations
of corresponding components from the working curve. For the sample whose element
content exceeds the concentration range of the working curve, it can be measured after
quantitative dilution.
7 Calculation
The content of the element to be measured is calculated based on the mass fraction wx
of the element to be measured, and the value is expressed in % and calculated according
to formula (1):
where:
ρ -- The concentration of the measured element in the test solution obtained from
the working curve, in micrograms per milliliter (μg/mL);
ρ0 -- The concentration of the measured element in the blank solution obtained from
the working curve, in micrograms per milliliter (μg/mL);
m -- The mass of the specimen, in grams (g);
V -- The volume of the test solution, in milliliters (mL).
The calculation results are rounded to two decimal places.
8 Precision
8.1 Repeatability
The measured values of two independent test results obtained under repeatability
conditions are within the average value range given below; the absolute difference
between the two test results does not exceed the repeatability limit (r), the probability
of exceeding the repeatability limit (r) does not exceed 5%, and the repeatability limit
(r) is obtained by linear interpolation according to the data in Table 4:
Share